All features
The Simple and Affordable Monitoring Software
Real-time Monitoring
- Performance Monitoring
- Process Usage
- Bandwidth
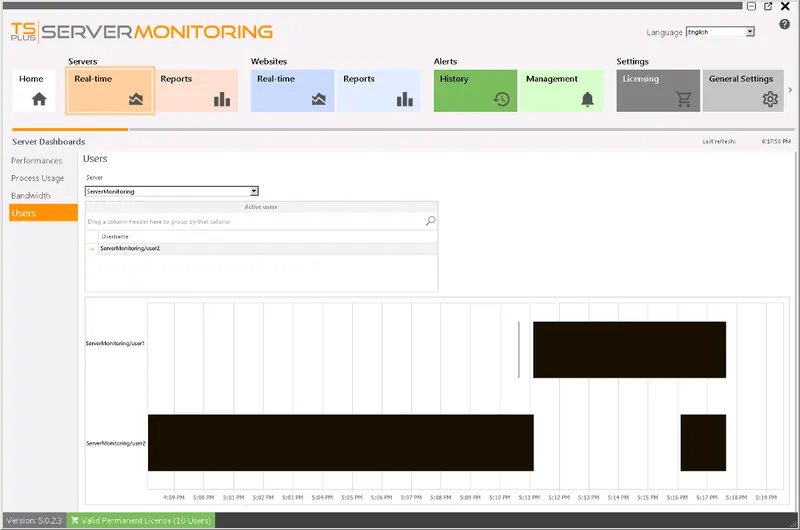
- Users
Display an overview of your server performance (CPU, Memory, Disk read and Disk write) over the last 10 minutes.
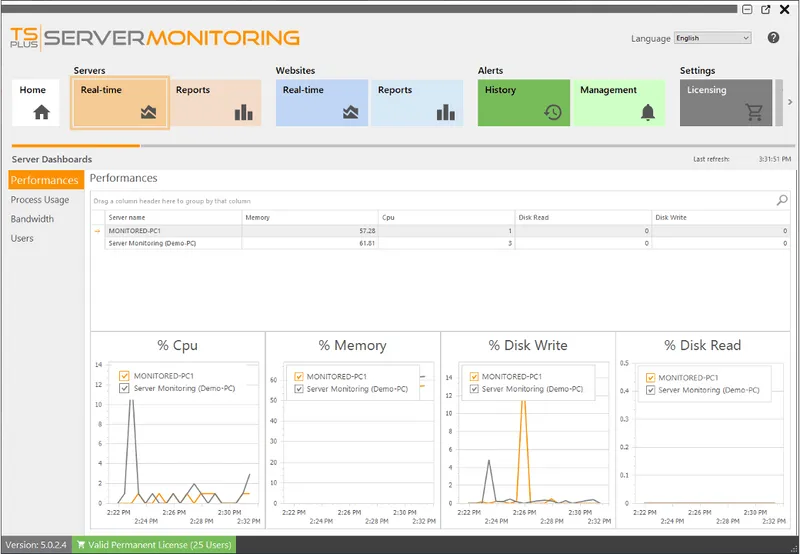
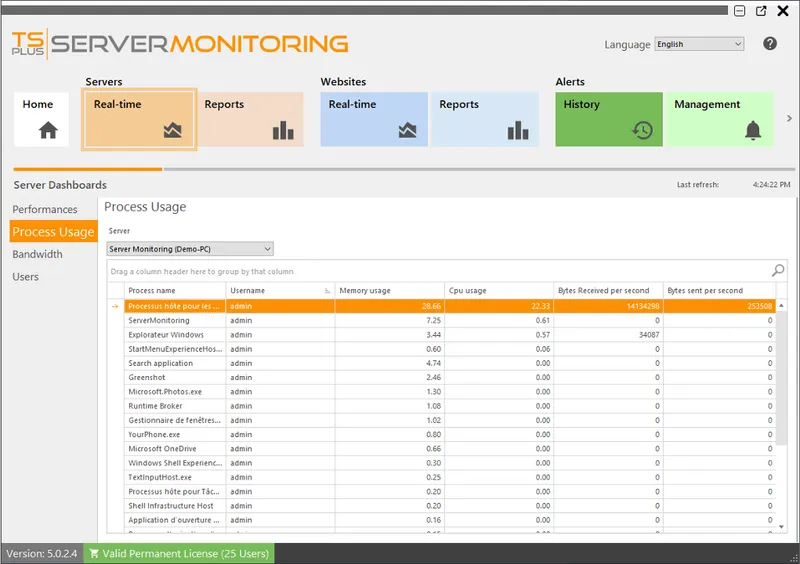
Show the processes currently used on the selected server, and other key indicators.
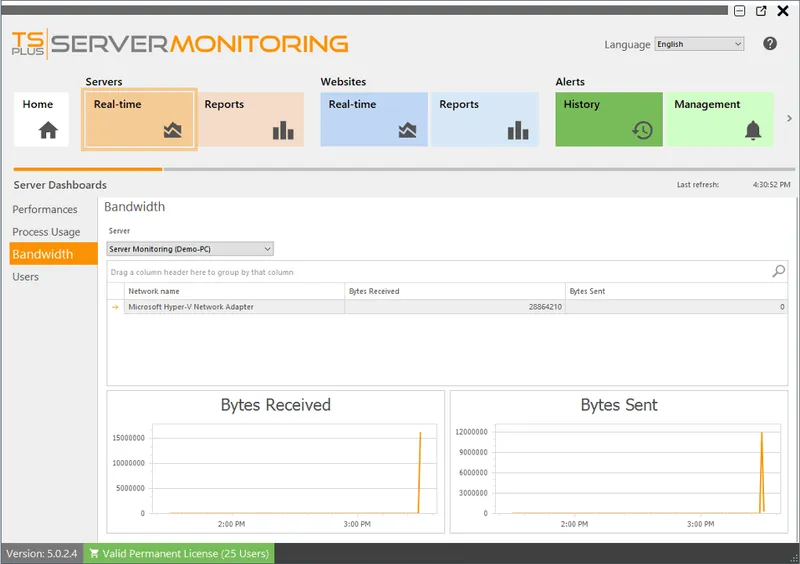
Monitor the bandwidth usage (up and down) of the selected server.
Display users currently connected to the selected server.
Reporting
- Customizable Reports
- Concurrent Sessions Report
- Performance Report
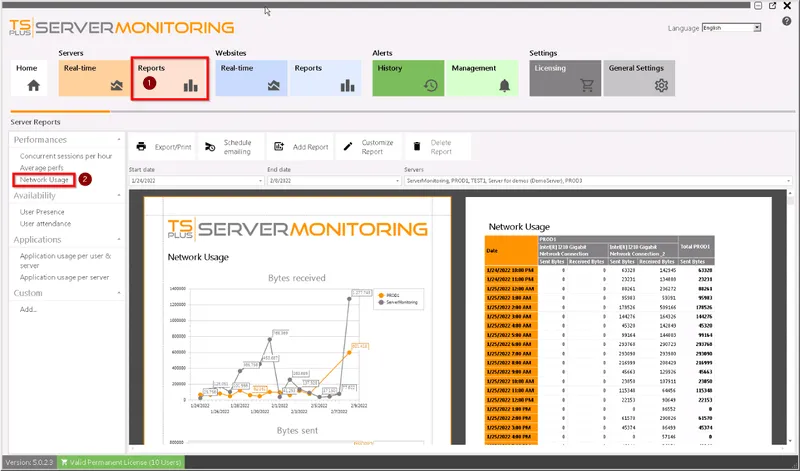
- Network Usage Report
- User Presence Report
- User Attendance Report
- Application Usage Report
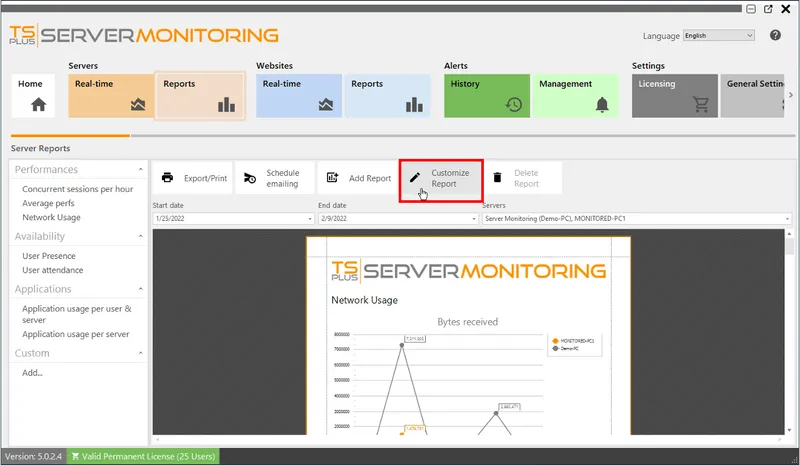
Use standard reports or customize your own to view, export, print or email your servers’ performance indicators.
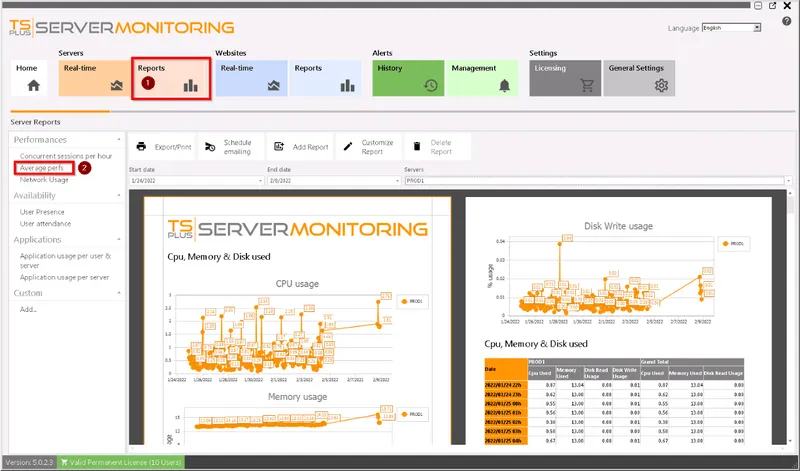
Display, export, print or email the number of concurrent sessions for the specified server(s) and period of time.
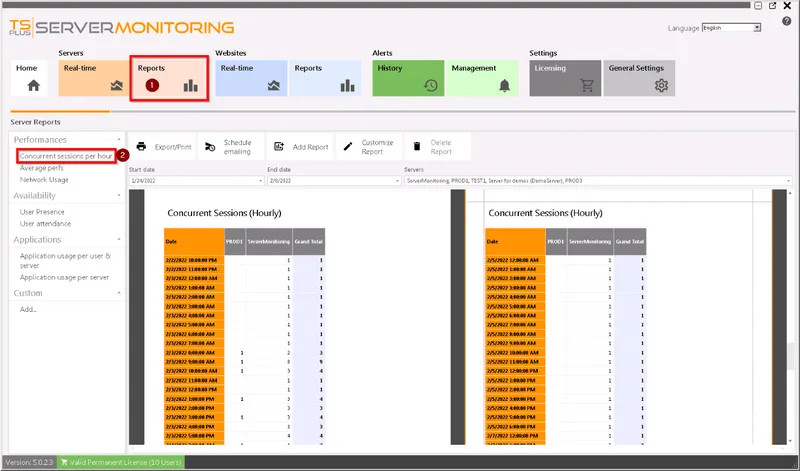
The Server average performance Report displays the average performance (CPU, Memory, and Disk usage) for the specified server(s) and period of time.

The Server average performance Report displays the average performance (CPU, Memory, and Disk usage) for the specified server(s) and period of time.
The User Presence Report displays the user presence for the specified server(s) and period of time.
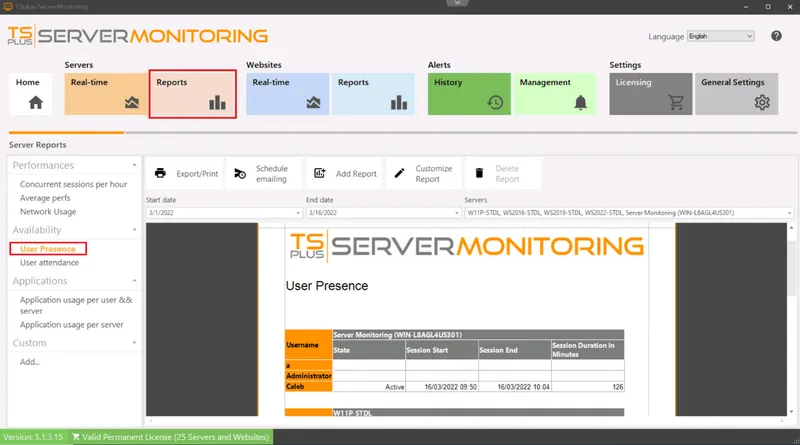
The Server average performance Report displays the average performance (CPU, Memory, and Disk usage) for the specified server(s) and period of time.
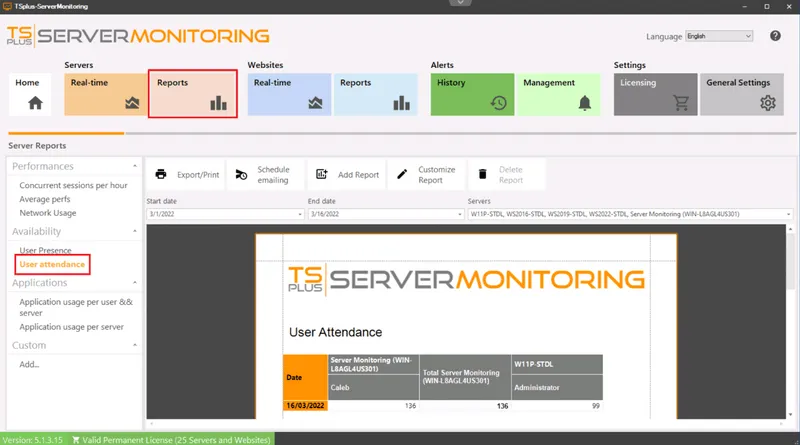
The Server average performance Report displays the average performance (CPU, Memory, and Disk usage) for the specified server(s) and period of time.
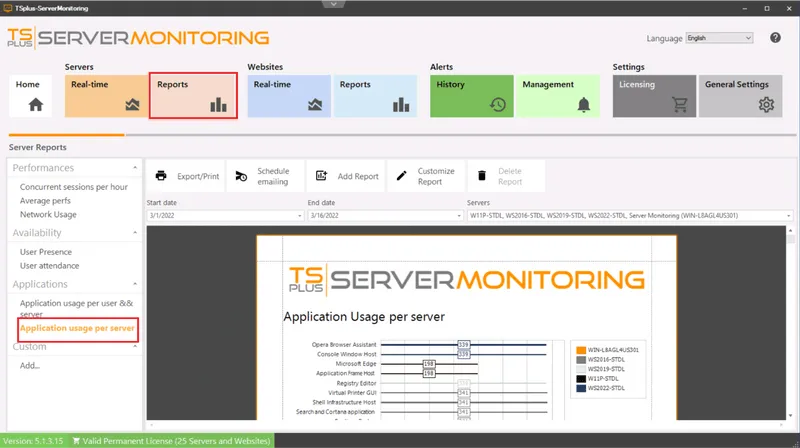
Website Features
- Real-time Monitoring
- Availability Report
- Response Code Report
- Response-time Report
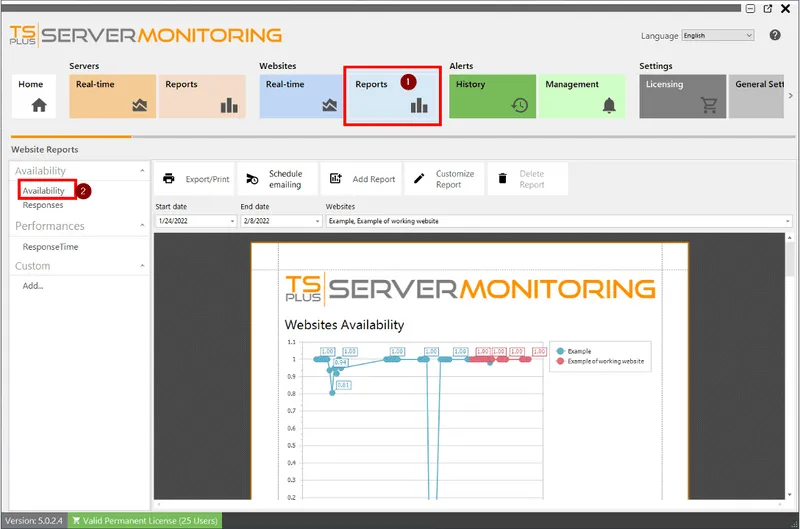
Easily check that all your websites have been running properly over the last 30 days, or the period of time of your choice. This simple real-time report includes an overview as well as the possibility to deep dive into specific machines, further into the past.
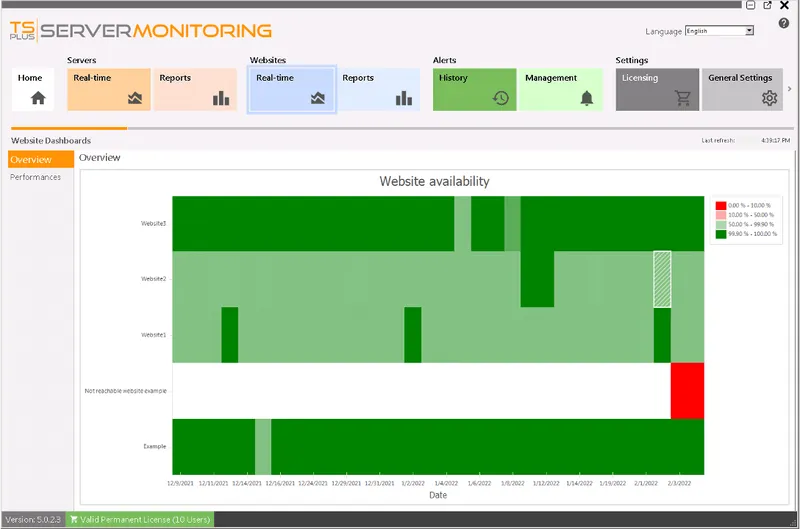
The Website Availability Report displays the uptime in percentage for the specified website and period of time you wish to analyze.
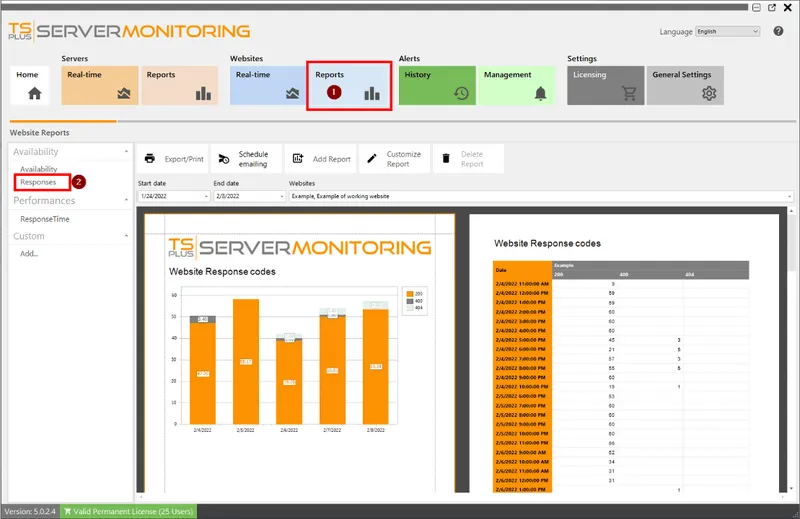
The Website Response Report displays the responses codes for the specified website and period of time.
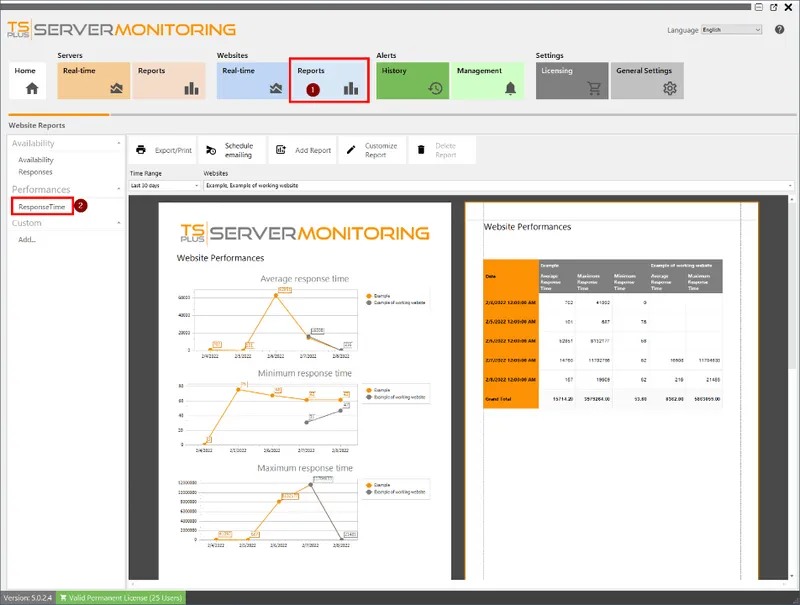
The Website Response Time Report displays the maximum, average and minimum response time in milliseconds for the specified website and period of time.
Alerts Management
- Server and Website Alerts
- Alert Customization
- Alert Notifications
When you start monitoring a server, the software automatically creates standard alerts sent to you by email when certain metrics’ thresholds are passed and come back to normal.
Set up server alerts for key metrics; processor, memory, disk read/write usage, disk used space, active users and downtime duration.
Website alerts include Response Time, Downtime Duration and incidentally Availability.
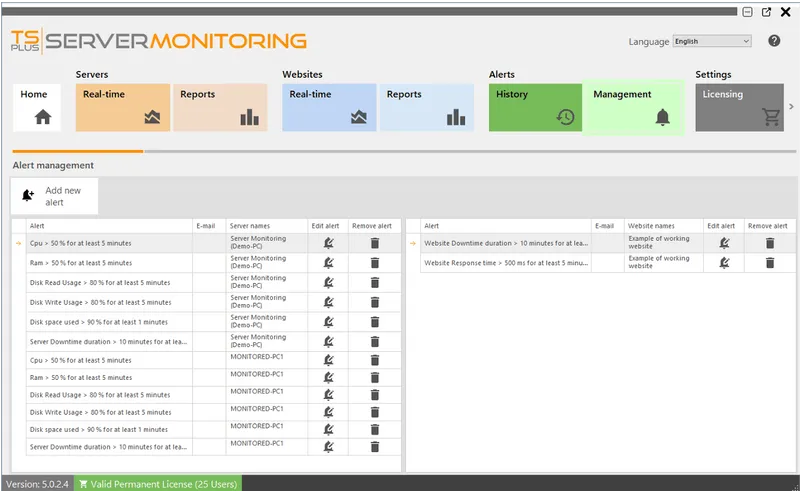
Create your own server or website alerts by defining specific thresholds for the metrics you want to monitor closely. When a threshold is passed or when the situation returns to normal, the system sends email notifications.
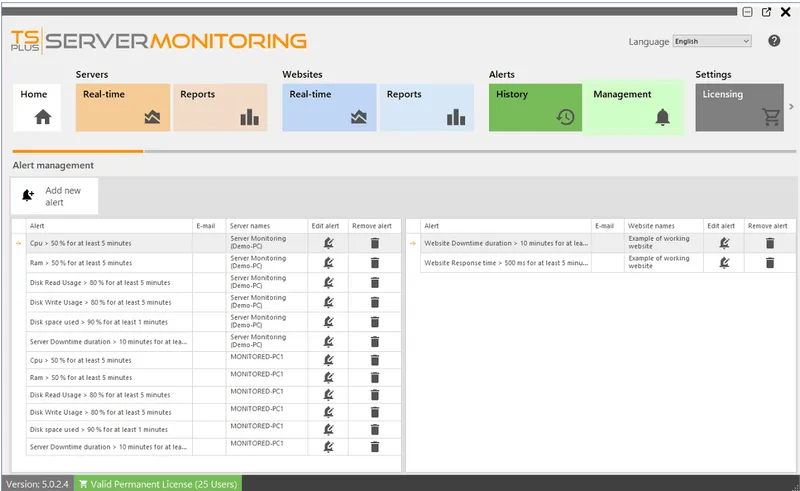
Server Monitoring will closely monitor the chosen metric and send you an email as soon as the targeted threshold is reached or exceeded. Server Monitoring will also send you an email when that metric is back to normal.You can decide to send an email to several recipients.
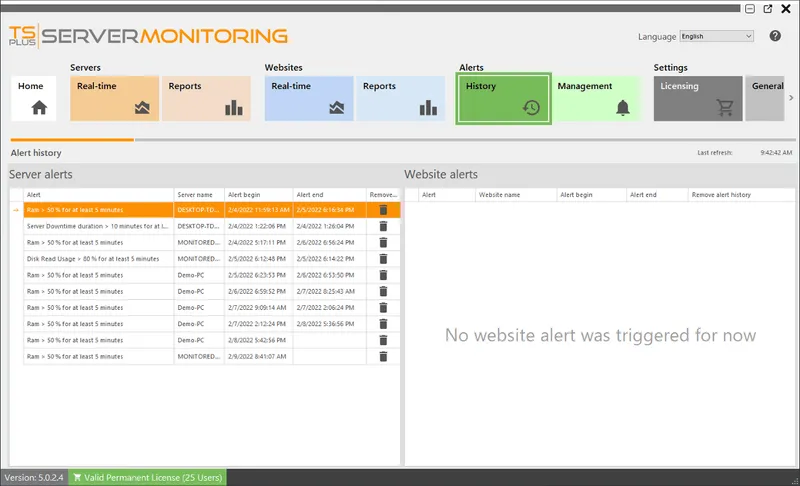
Additionally, easily check the history of your alerts via your dashboard.
Admin Tool and Customization
- All-in-one Dashboard
- Server and Website Management
- Settings
- Report Customization
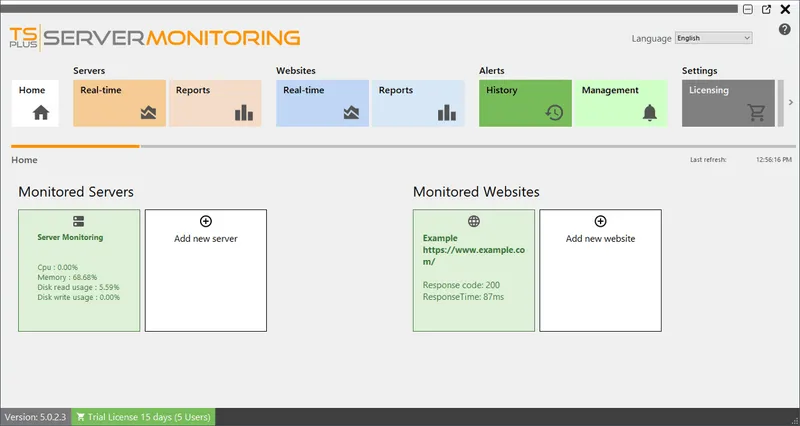
All-in-one Dashboard
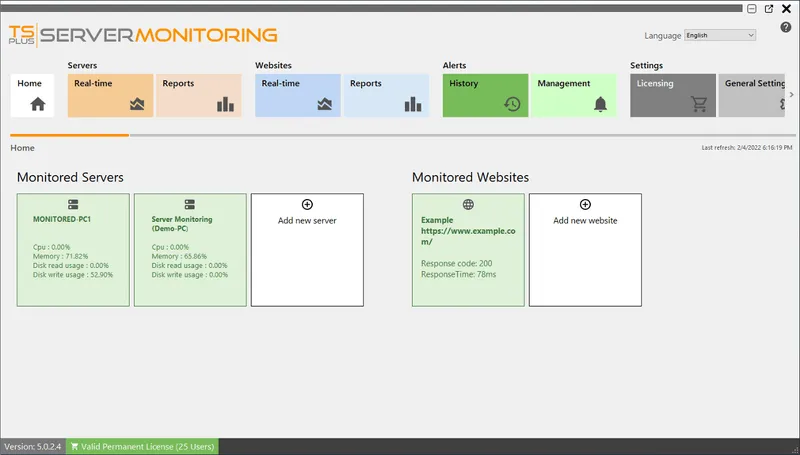
Server and Website Management
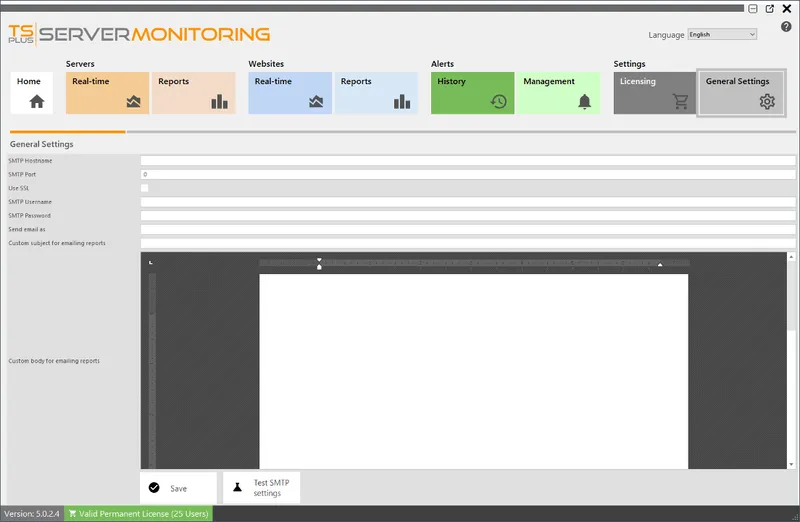
Settings
Report Customization
Quickly change your logo, colors and chart types. Filter your data the way you want. Hide the elements that aren’t needed in your reports. Brand your reports and customize them so that they make sense in your context.
More about report customization »
