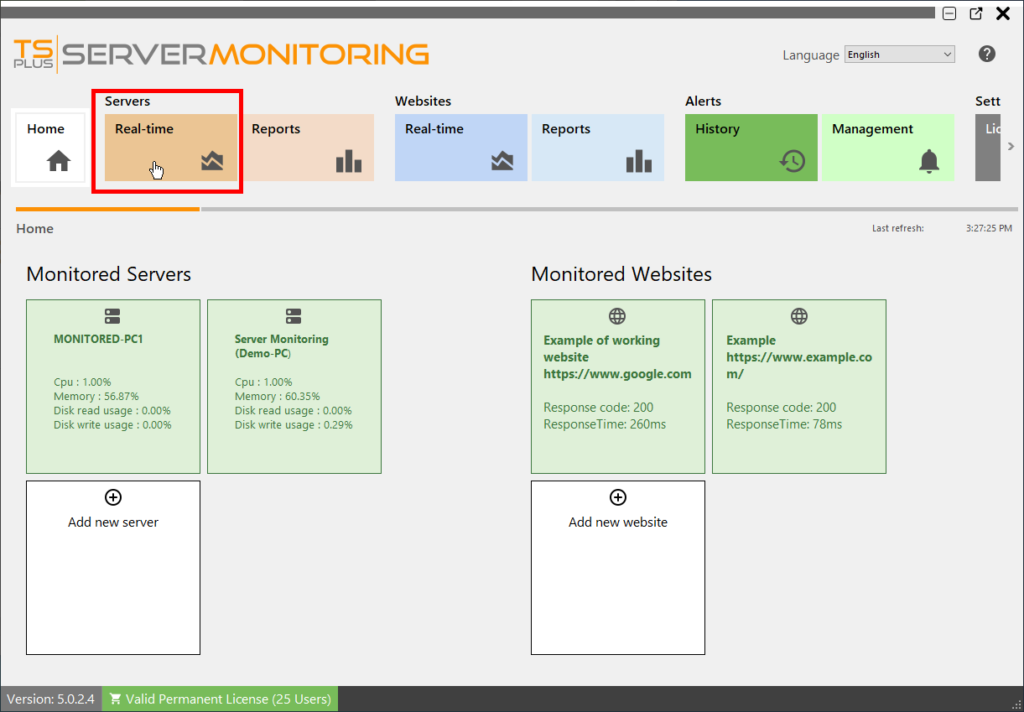
To have access to real-time features for servers, click on the “Real-time” tile in the Servers section:
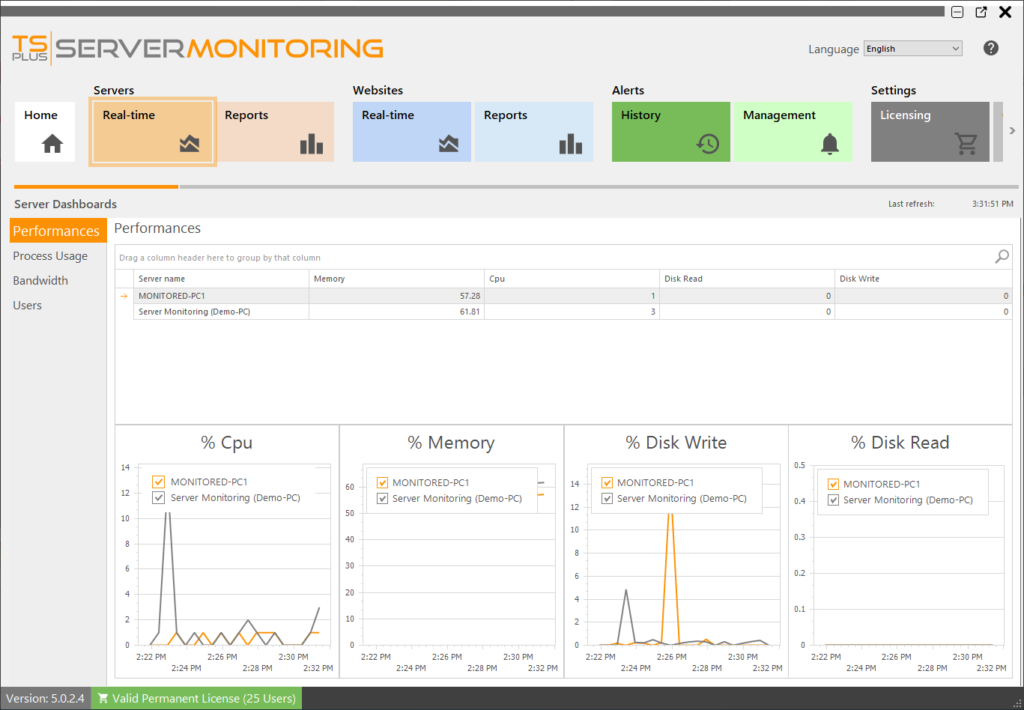
Performance
This displays an overview of your server performance (CPU, Memory, Disk write and Disk read), over the last 10 minutes:
Process usage
When clicking on “Process usage” in the menu on the left, you will see a table showing the processes currently used on the selected server, and some key indicators:
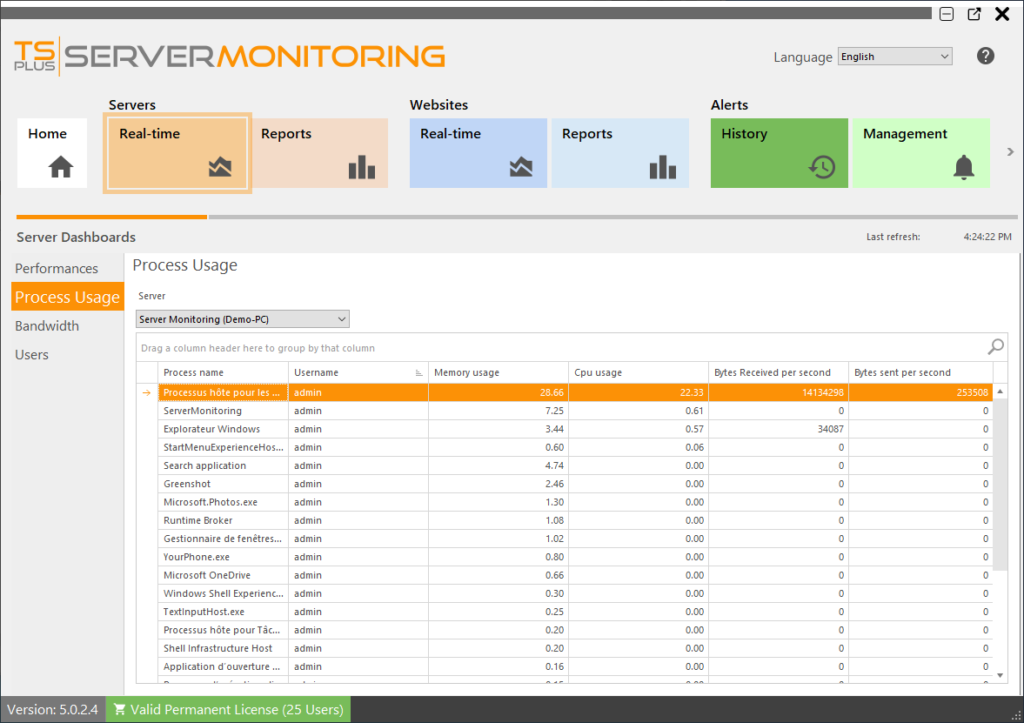
You can filter by server.
Bandwidth
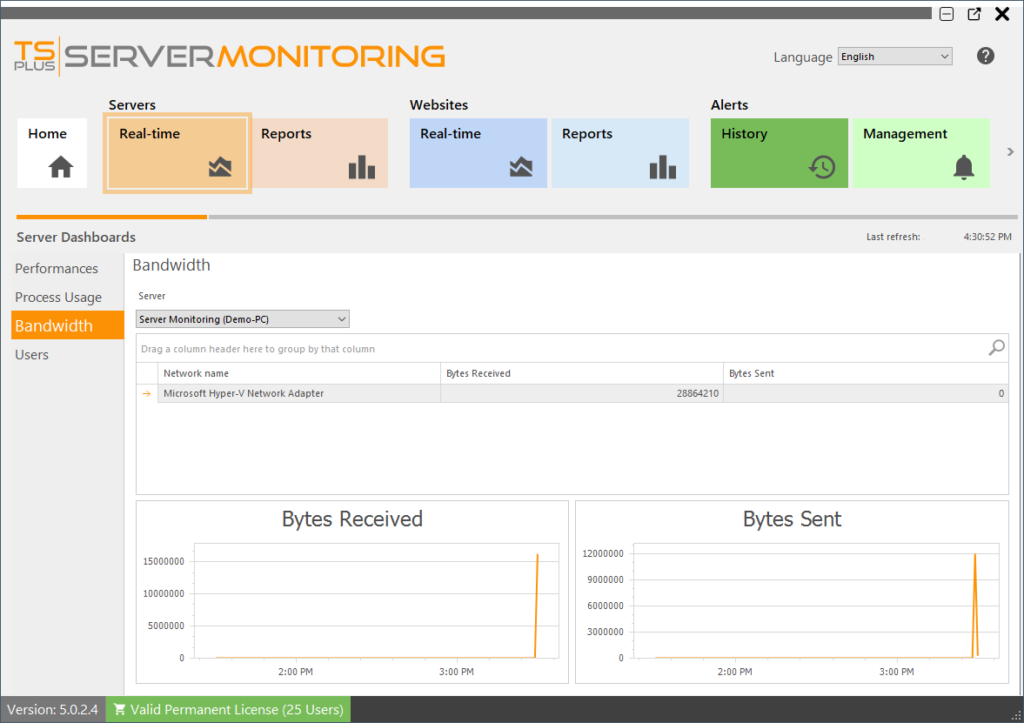
When clicking on “Bandwidth” in the menu on the left, you will see a table showing the bandwidth usage (up and down) of the selected server:
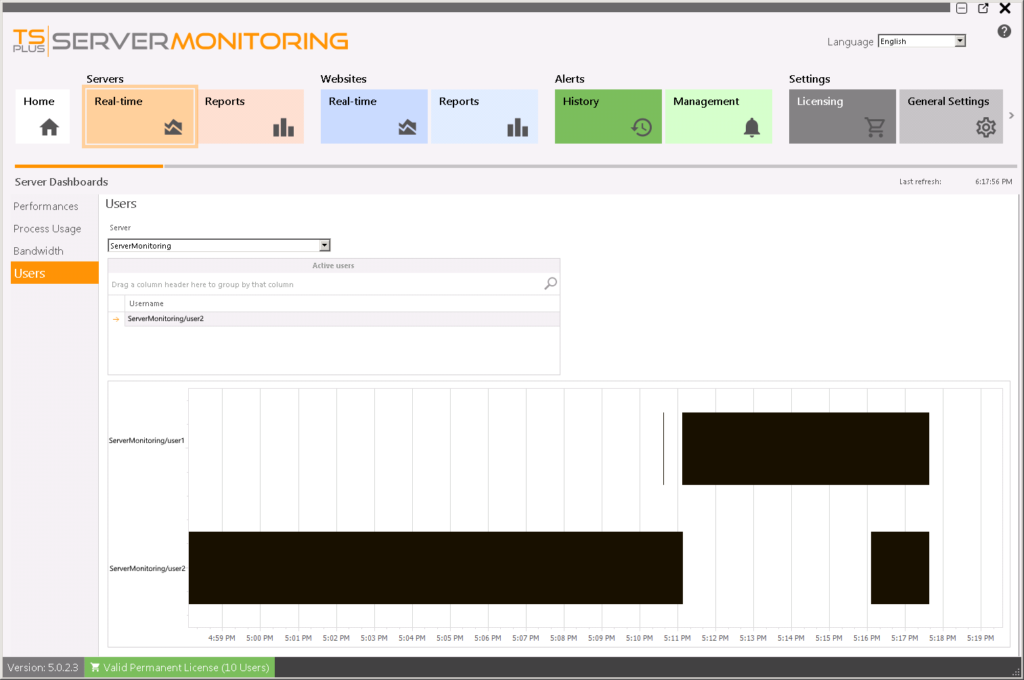
Users
When clicking on “Users” in the menu on the left, you will see a table and a graph showing the users currently connected to the selected server:
