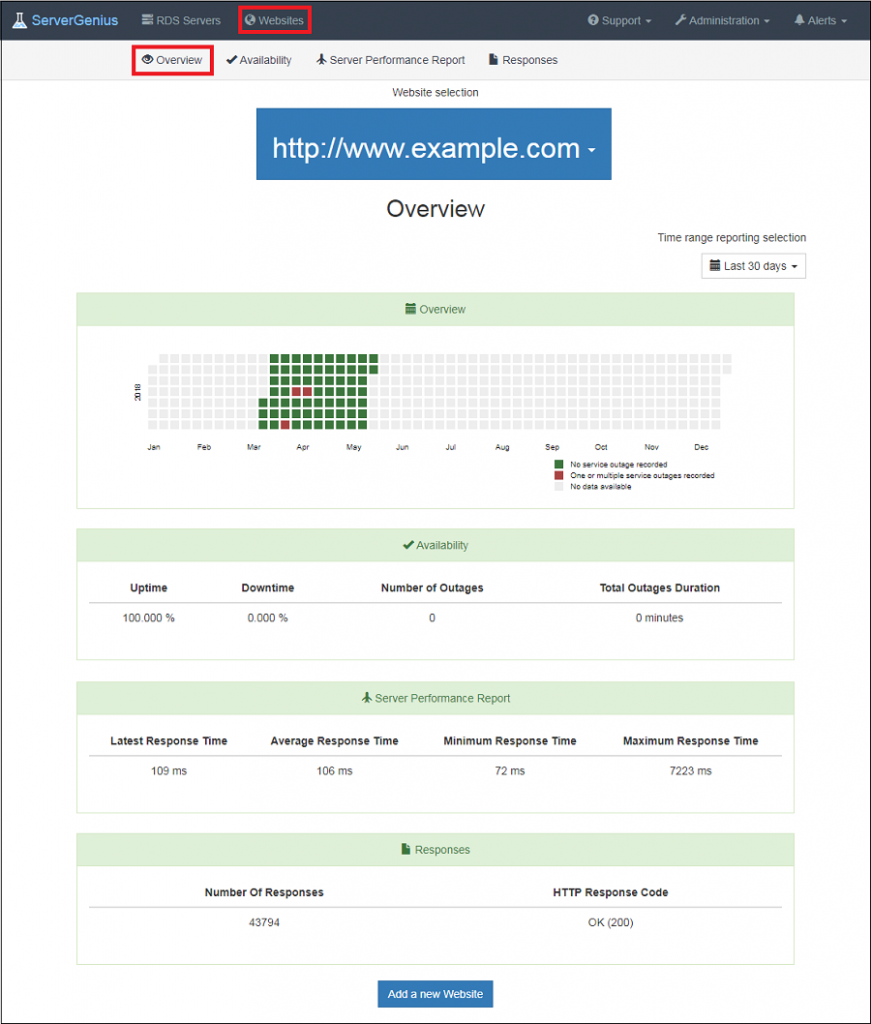
This report is available by clicking on the Overview tab from the Websites menu on ServerGenius web interface.
The Website Overview Report provides the following information:
An heat map highlighting the website health for the past years. A red square indicates that the website was subject of one or multiple outages during the day. An outage means that the website was unreachable by ServerGenius or the website response code is an error code.
Availability panel presents the calculated uptime and downtime in percentage for the specified period of time ; as well as the number of outages registered and the outages total duration in minutes.
Performance panel displays the latest, average, minimum and maximum response time in milliseconds for the specified period of time.
Responses panel list the number of responses by response category.
The period of time can be customized by using the date-range picker at the top right of the web page. Please note that the heat-map will display the complete years corresponding to the selected period of time.
